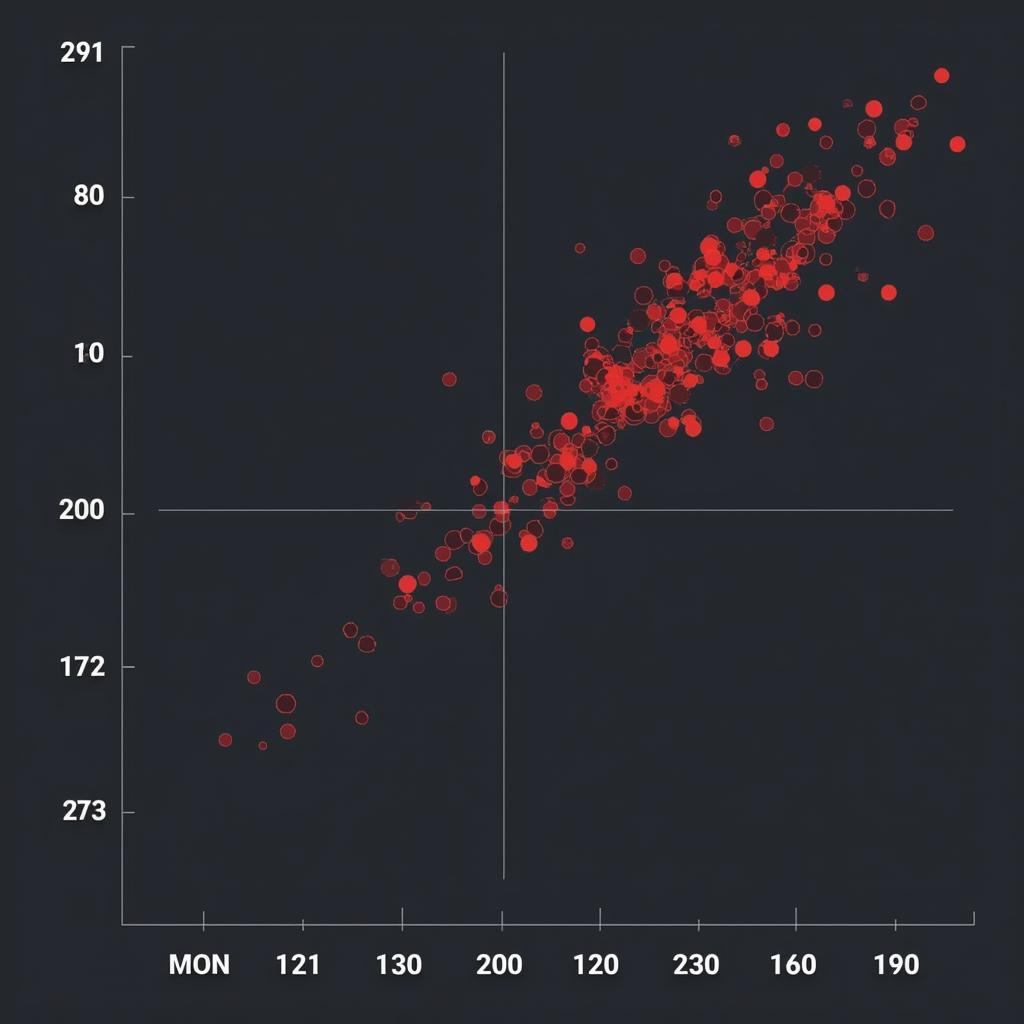
Highlighting specific data points in a Python plot is crucial for emphasizing key insights and making your visualizations more impactful. Whether you’re analyzing sales trends, scientific data, or financial performance, knowing how to effectively highlight points in your plots can significantly enhance your storytelling and data communication.
 Highlighting Points in a Python Plot
Understanding the Importance of Highlighting Points in Python Plots
Highlighting specific data points allows you to draw attention to outliers, significant trends, or particular values of interest. This can be especially useful when presenting data to a non-technical audience, as it helps them quickly grasp the key takeaways from your visualizations. For instance, imagine you’re analyzing website traffic data. Highlighting the days with unusually high traffic spikes can immediately point towards potential marketing campaign successes or external events that influenced user behavior.
Techniques for Highlight Points in Plot Python
Several techniques exist to highlight points in Python plots, each offering different levels of customization and control. Let’s explore some of the most effective methods:
-
Using Different Markers: Changing the marker style and size of specific points can effectively draw attention to them. For example, you can use a star marker for important data points while keeping the rest as circles.
-
Altering Colors: Assigning different colors to specific points can create a visual distinction. You can use vibrant colors for your highlighted points and more muted colors for the rest of the data.
-
Annotations: Adding text annotations directly next to the highlighted points can provide context and explain their significance. For example, you can annotate a high sales point with the specific marketing campaign that led to that increase.
-
Zooming In: If you have a dense plot, zooming in on the region containing the highlighted points can make them more visible and easier to analyze.
Implementing Highlight Points with Matplotlib and Seaborn
Python libraries like Matplotlib and Seaborn offer powerful tools for creating and customizing plots. Here’s a step-by-step guide on how to highlight points using Matplotlib:
-
Import Matplotlib:
import matplotlib.pyplot as plt -
Create Your Plot: Define your x and y data and plot it using
plt.plot()orplt.scatter(). -
Highlight Points: Use the
plt.scatter()function again to plot your highlighted points with different marker styles, colors, and sizes. -
Add Annotations: Use
plt.annotate()to add text labels next to the highlighted points.
A similar approach can be used with Seaborn, leveraging its higher-level functions for more aesthetically pleasing visualizations. For instance, you can use sns.scatterplot() to create a scatter plot and then highlight specific points by overlaying another scatter plot with different styling.
highlight points in r plot offers a comparative perspective on achieving similar results in another popular data visualization language.
“Highlighting key data points isn’t just about aesthetics; it’s about effectively communicating the story your data is telling,” says Dr. Anya Sharma, a leading data visualization expert. “By using color, markers, and annotations strategically, you can transform a simple plot into a powerful tool for insight generation.”
Conclusion
Highlighting points in your Python plots is a crucial skill for effective data visualization. By employing the techniques discussed above and leveraging libraries like Matplotlib and Seaborn, you can create compelling visuals that clearly communicate key insights and enhance your data storytelling. Mastering highlight points in plot python allows you to direct attention to critical areas, making your data analysis more impactful and insightful.
FAQ
- How can I highlight multiple points with different colors?
- What are the best practices for choosing colors for highlighting?
- How do I add annotations to highlighted points in Seaborn?
- Can I highlight points based on a specific condition?
- What are some common mistakes to avoid when highlighting points?
- How do I combine different highlighting techniques effectively?
- How can I highlight points in 3D plots?
For any assistance regarding highlighting points in plots or other Python programming queries, feel free to contact us. Call us at 0372999996, email us at [email protected], or visit our office at 236 Cầu Giấy, Hà Nội. We have a 24/7 customer support team ready to assist you.